Preparing data
Download data and read into R as Seurat objects
stadia function supports a list of Seurat objects as inputs to conduct STADIA algorithm. Using the 10X visium platform data sets as example to explain how to prepare the lists of Seurat objects.
- Firstly download raw datasets from 10X
Genomics, and save the datasets in
./section1_anteriorand./section1_posteriordirectories -
spatial/subdirectory contains the spatial locations of each spots and the corresponding H&E images -
filtered_feature_bc_matrix.h5file contains the gene expression count data - With the help of
lapplyfunction andLoad10X_Spatial()function in Seurat R package, we read the expression count data with the corresponding location in a list of Seurat Objects.
# read data
dirs <- c("./section1_anterior", "./section1_posterior")
mbrain2 <- lapply(dirs, function(x) {
    filename <- list.files(pattern = "filtered_feature_bc_matrix.h5", path = x, full.names = FALSE)
    seu <- Load10X_Spatial(data.dir = x, filename = filename)
    seu$row <- seu@images[[names(seu@images)]]@coordinates$row
    seu$col <- seu@images[[names(seu@images)]]@coordinates$col
    seu
})
names(mbrain2) <- str_remove(dirs, ".+_")

# save to use in model
save(mbrain2, file = "./data/mbrain2.RData")
Visualizing the molecular counts across spots
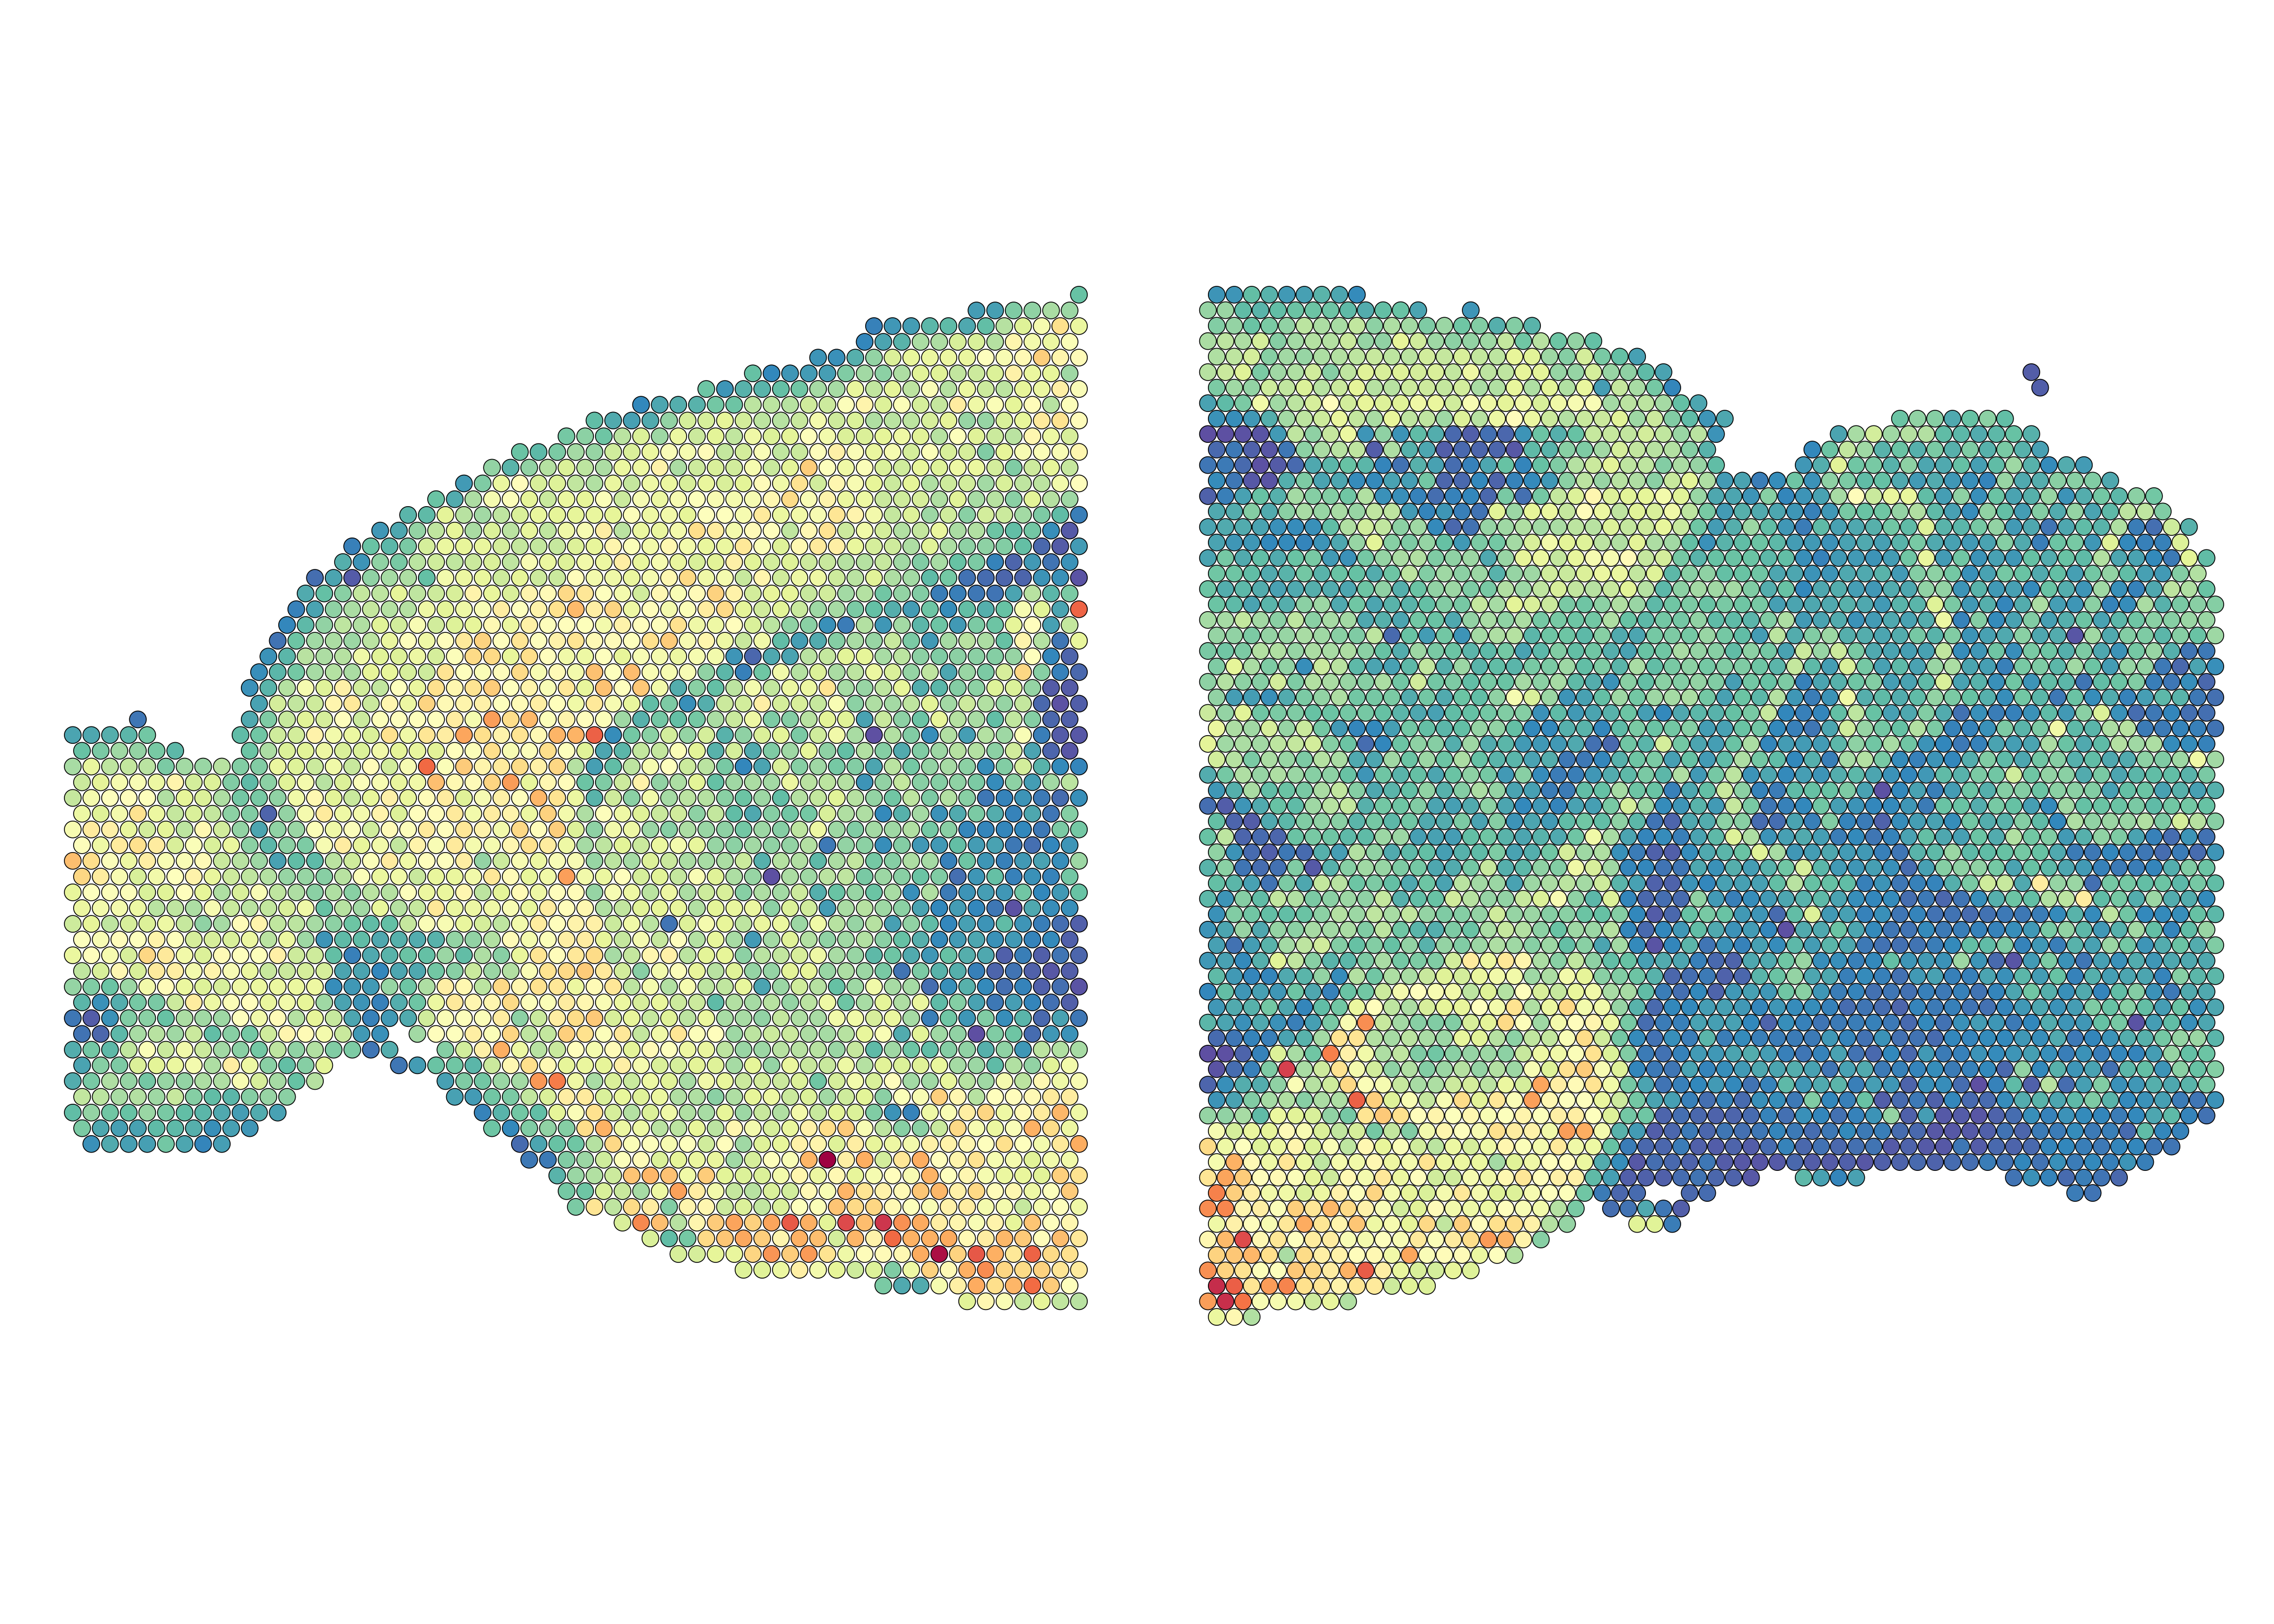
After prepare the Seurat objects, we firstly visualize the molecular counts across spots.
((SpatialFeaturePlot(mbrain2[[1]], features = "nCount_Spatial", image.alpha = 0) + xlim(80,470)) |
        (SpatialFeaturePlot(mbrain2[[2]], features = "nCount_Spatial", image.alpha = 0)+ xlim(110, 525))) &
theme(legend.position = "none", plot.margin = unit(c(0,0,0,0), "cm")) 
Run STADIA algorithm using stadia package
Setup hyperparameters
There are three key hyperparameters in stadia()
function,
- n_cluster: the number of spatial domains (clusters)
- dim: the dimension of latent factors
- etas: the smoothness parameter in Potts model
For this dataset, we set these three hyperparameters are
K=35, d=35 and etas=0.15,
respectively.
Dimensionality reduction, batch effects correction and spatial clustering
# load package
library(stadia)

# load data
load("./data/mbrain2.RData")

# run model
K <- 35
d <- 35
etas <- 0.15
set.seed(123)
system.time({
    ## set hyperparameters
    hyper <- HyperParameters(mbrain2, dim= d, eta = etas)
    ## run model
    mbrain2_stadia <- stadia(mbrain2, hyper, dim = d, n_cluster = K,
                           platform = "visium", em.maxiter = 30)
})

# save result
if(!dir.exists('./result')) dir.create('./result')
save(mbrain2_stadia, file = './result/mbrain2_stadia.RData')
Visualizing spatial clusters
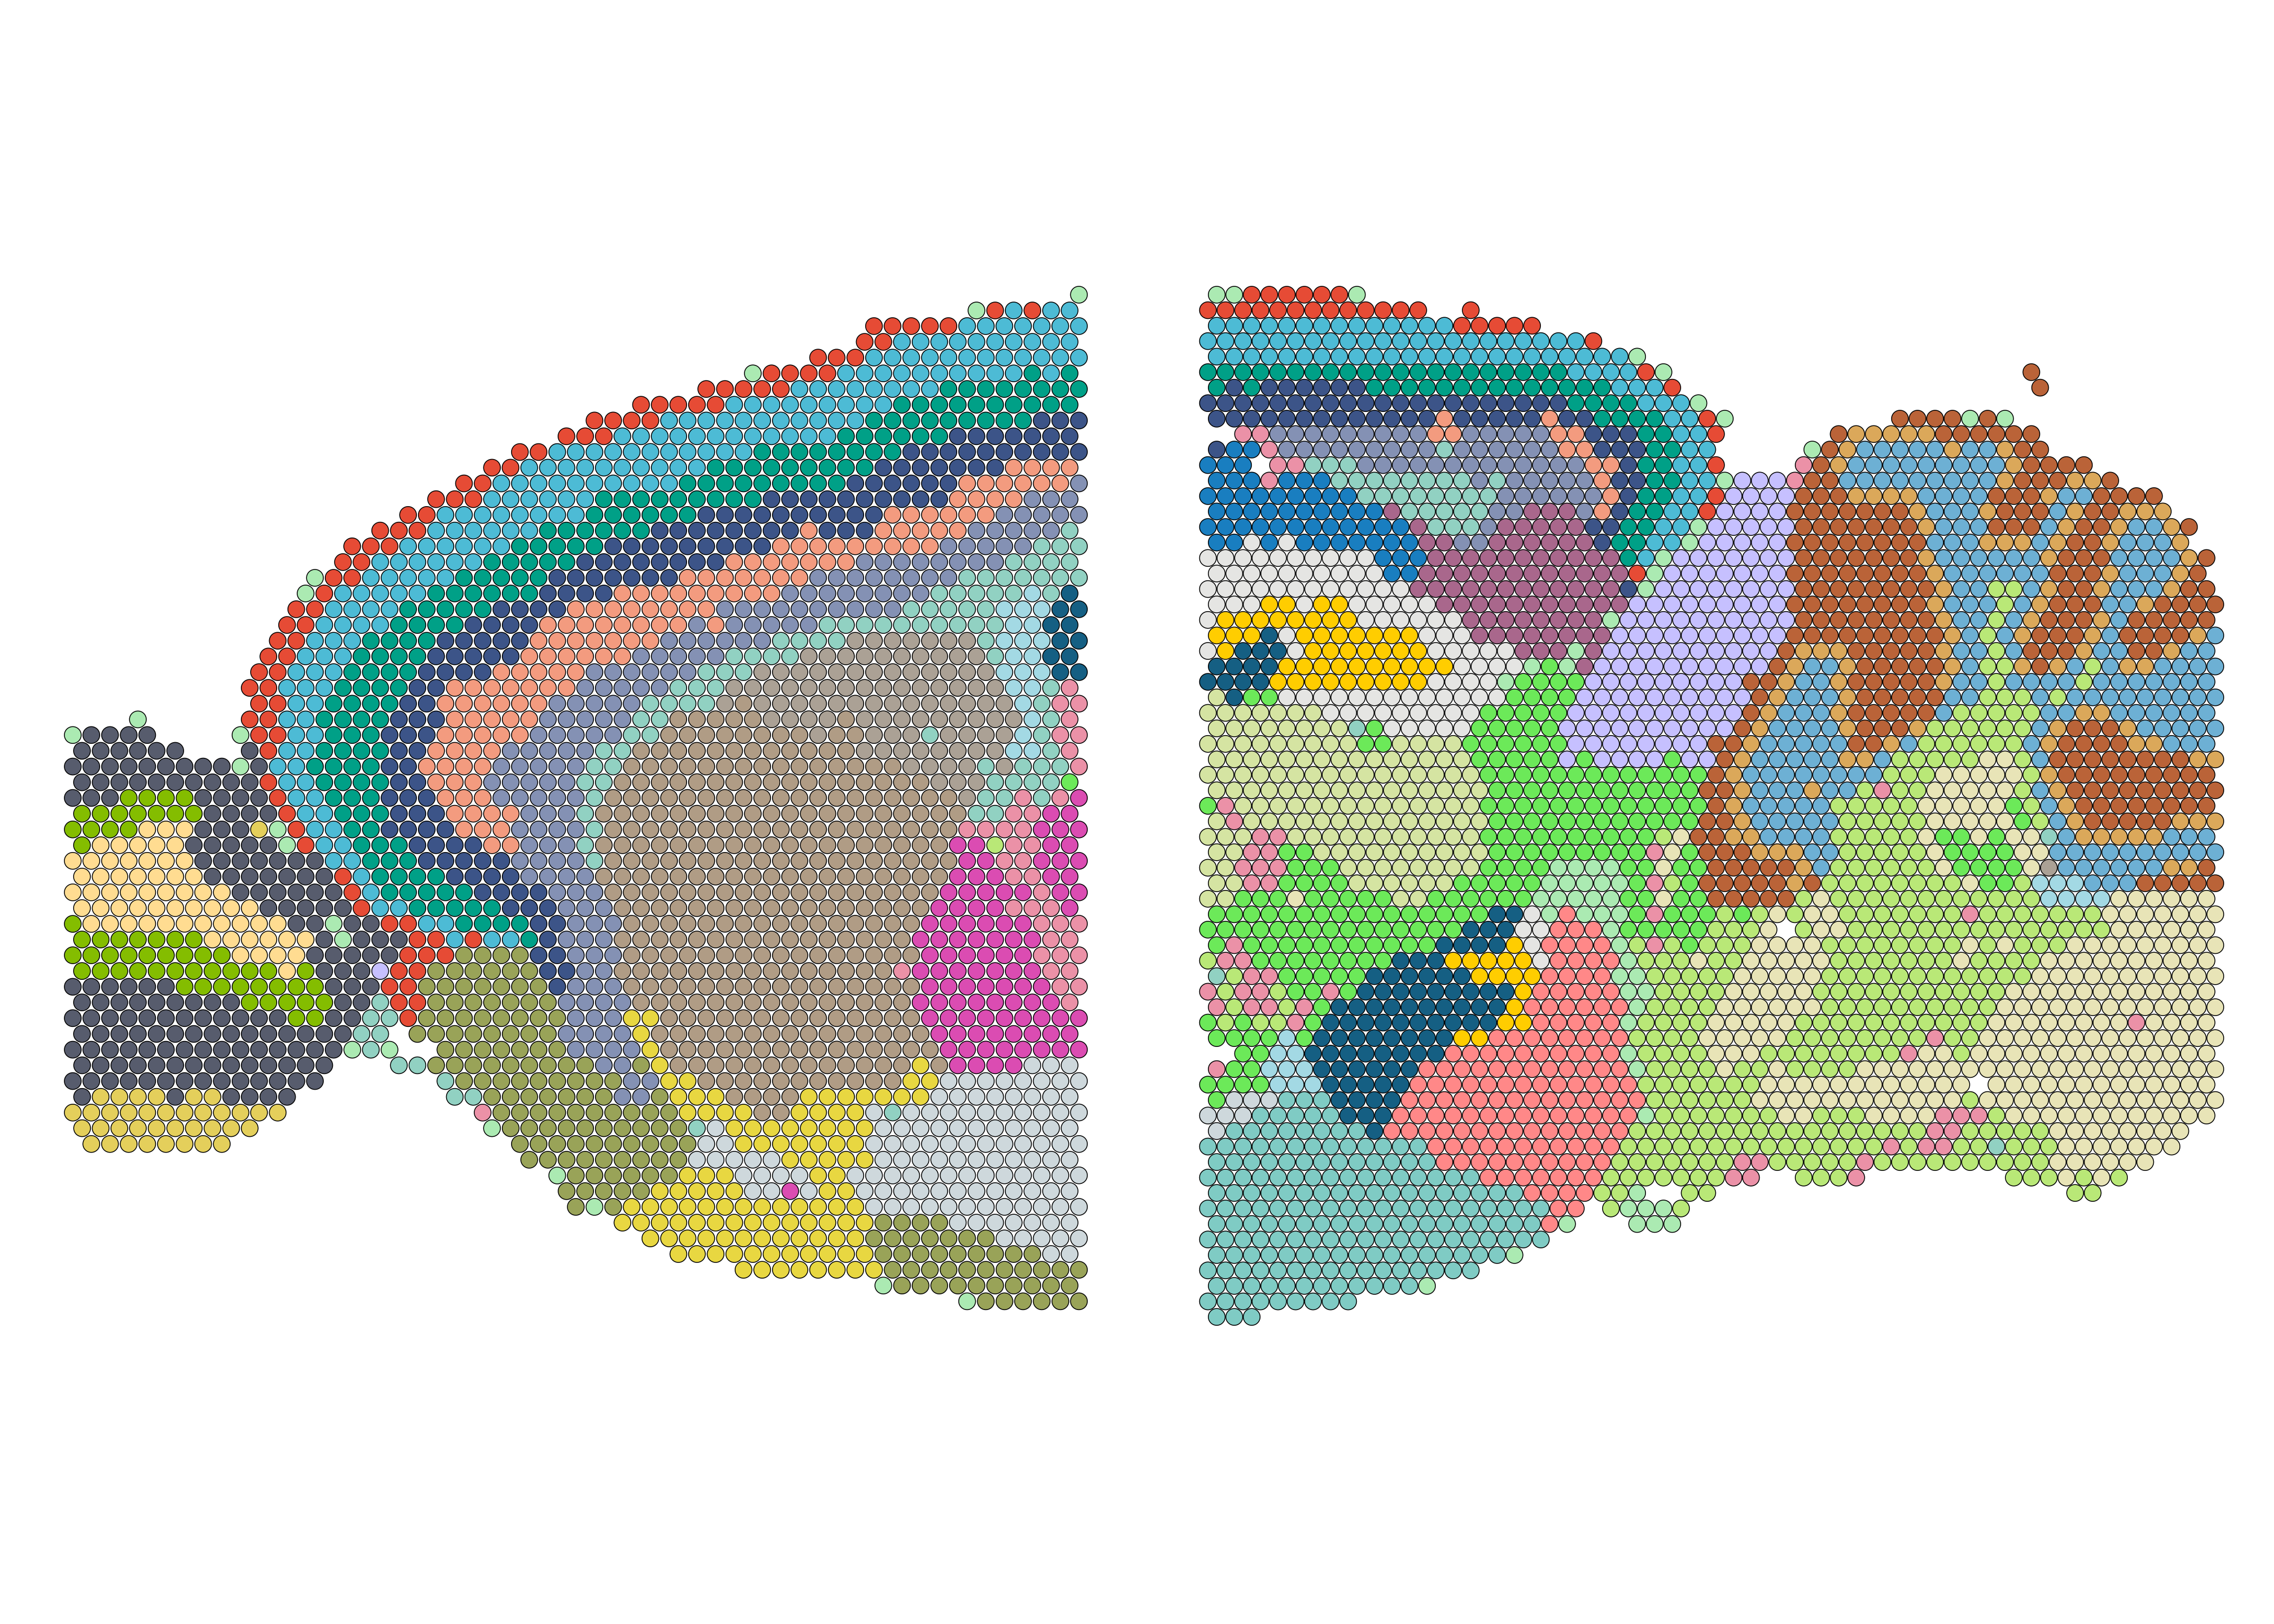
We can check if the spatial domains aligned well across two slices by visualizing clusters spatially.
## number of spots in each slice
slice_spotNo <- mbrain2 %>%
    sapply(function(x) {
        ncol(subset(x = x, subset = nFeature_Spatial > 200))
    })
## split result into each slice
stadia_each <- mbrain2_stadia$c_vec %>%
    as.vector() %>%
    as.factor() %>%
    split(f = rep(1:2, times = slice_spotNo))
## add as meta.data
mbrain2 <- lapply(1:2, function(i){
    mbrain2[[i]] <- subset(x = mbrain2[[i]], subset = nFeature_Spatial > 200)
    mbrain2[[i]]$stadia_annotation <- stadia_each[[i]]
    return(mbrain2[[i]])
})
# visualization
clusterCol <- c("#ABEAB2", "#CED8DCFF", "#3C5488FF", "#BA6338FF", "#99A358",
                "#EB91A7", "#00A087FF", "#E64B35FF", "#4DBBD5FF", "#DBA85A",
                "#575C6DFF", "#91D1C2FF", "#8491B4FF", "#FFDC91FF", "#ABA195",
                "#7FCBC4FF", "#DB4CB2",   "#A9678C", "#6DB0D4", "#F39B7FFF",
                "#155F83FF", "#E4CF5BFF", "#E8E4B7", "#84BD00FF", "#D5E4A2FF",
                "#B9E877", "#C6C0FFFF", "#B09C85FF", "#E8D741", "#FF8888FF",
                "#E5E5E3", "#197EC0FF", "#6CE959", "#FFCD00FF", "#A3D9E4")
names(clusterCol) <- 1:length(clusterCol)
((SpatialPlot(mbrain2[[1]], group.by = "stadia_annotation", image.alpha = 0, cols = clusterCol) + xlim(80,470)) |
        (SpatialPlot(mbrain2[[2]], group.by = "stadia_annotation", image.alpha = 0, cols = clusterCol)+ xlim(110, 525))) &
    theme(legend.position = "none", plot.margin = unit(c(0,0,0,0), "cm"))
Visualizing particular tissues
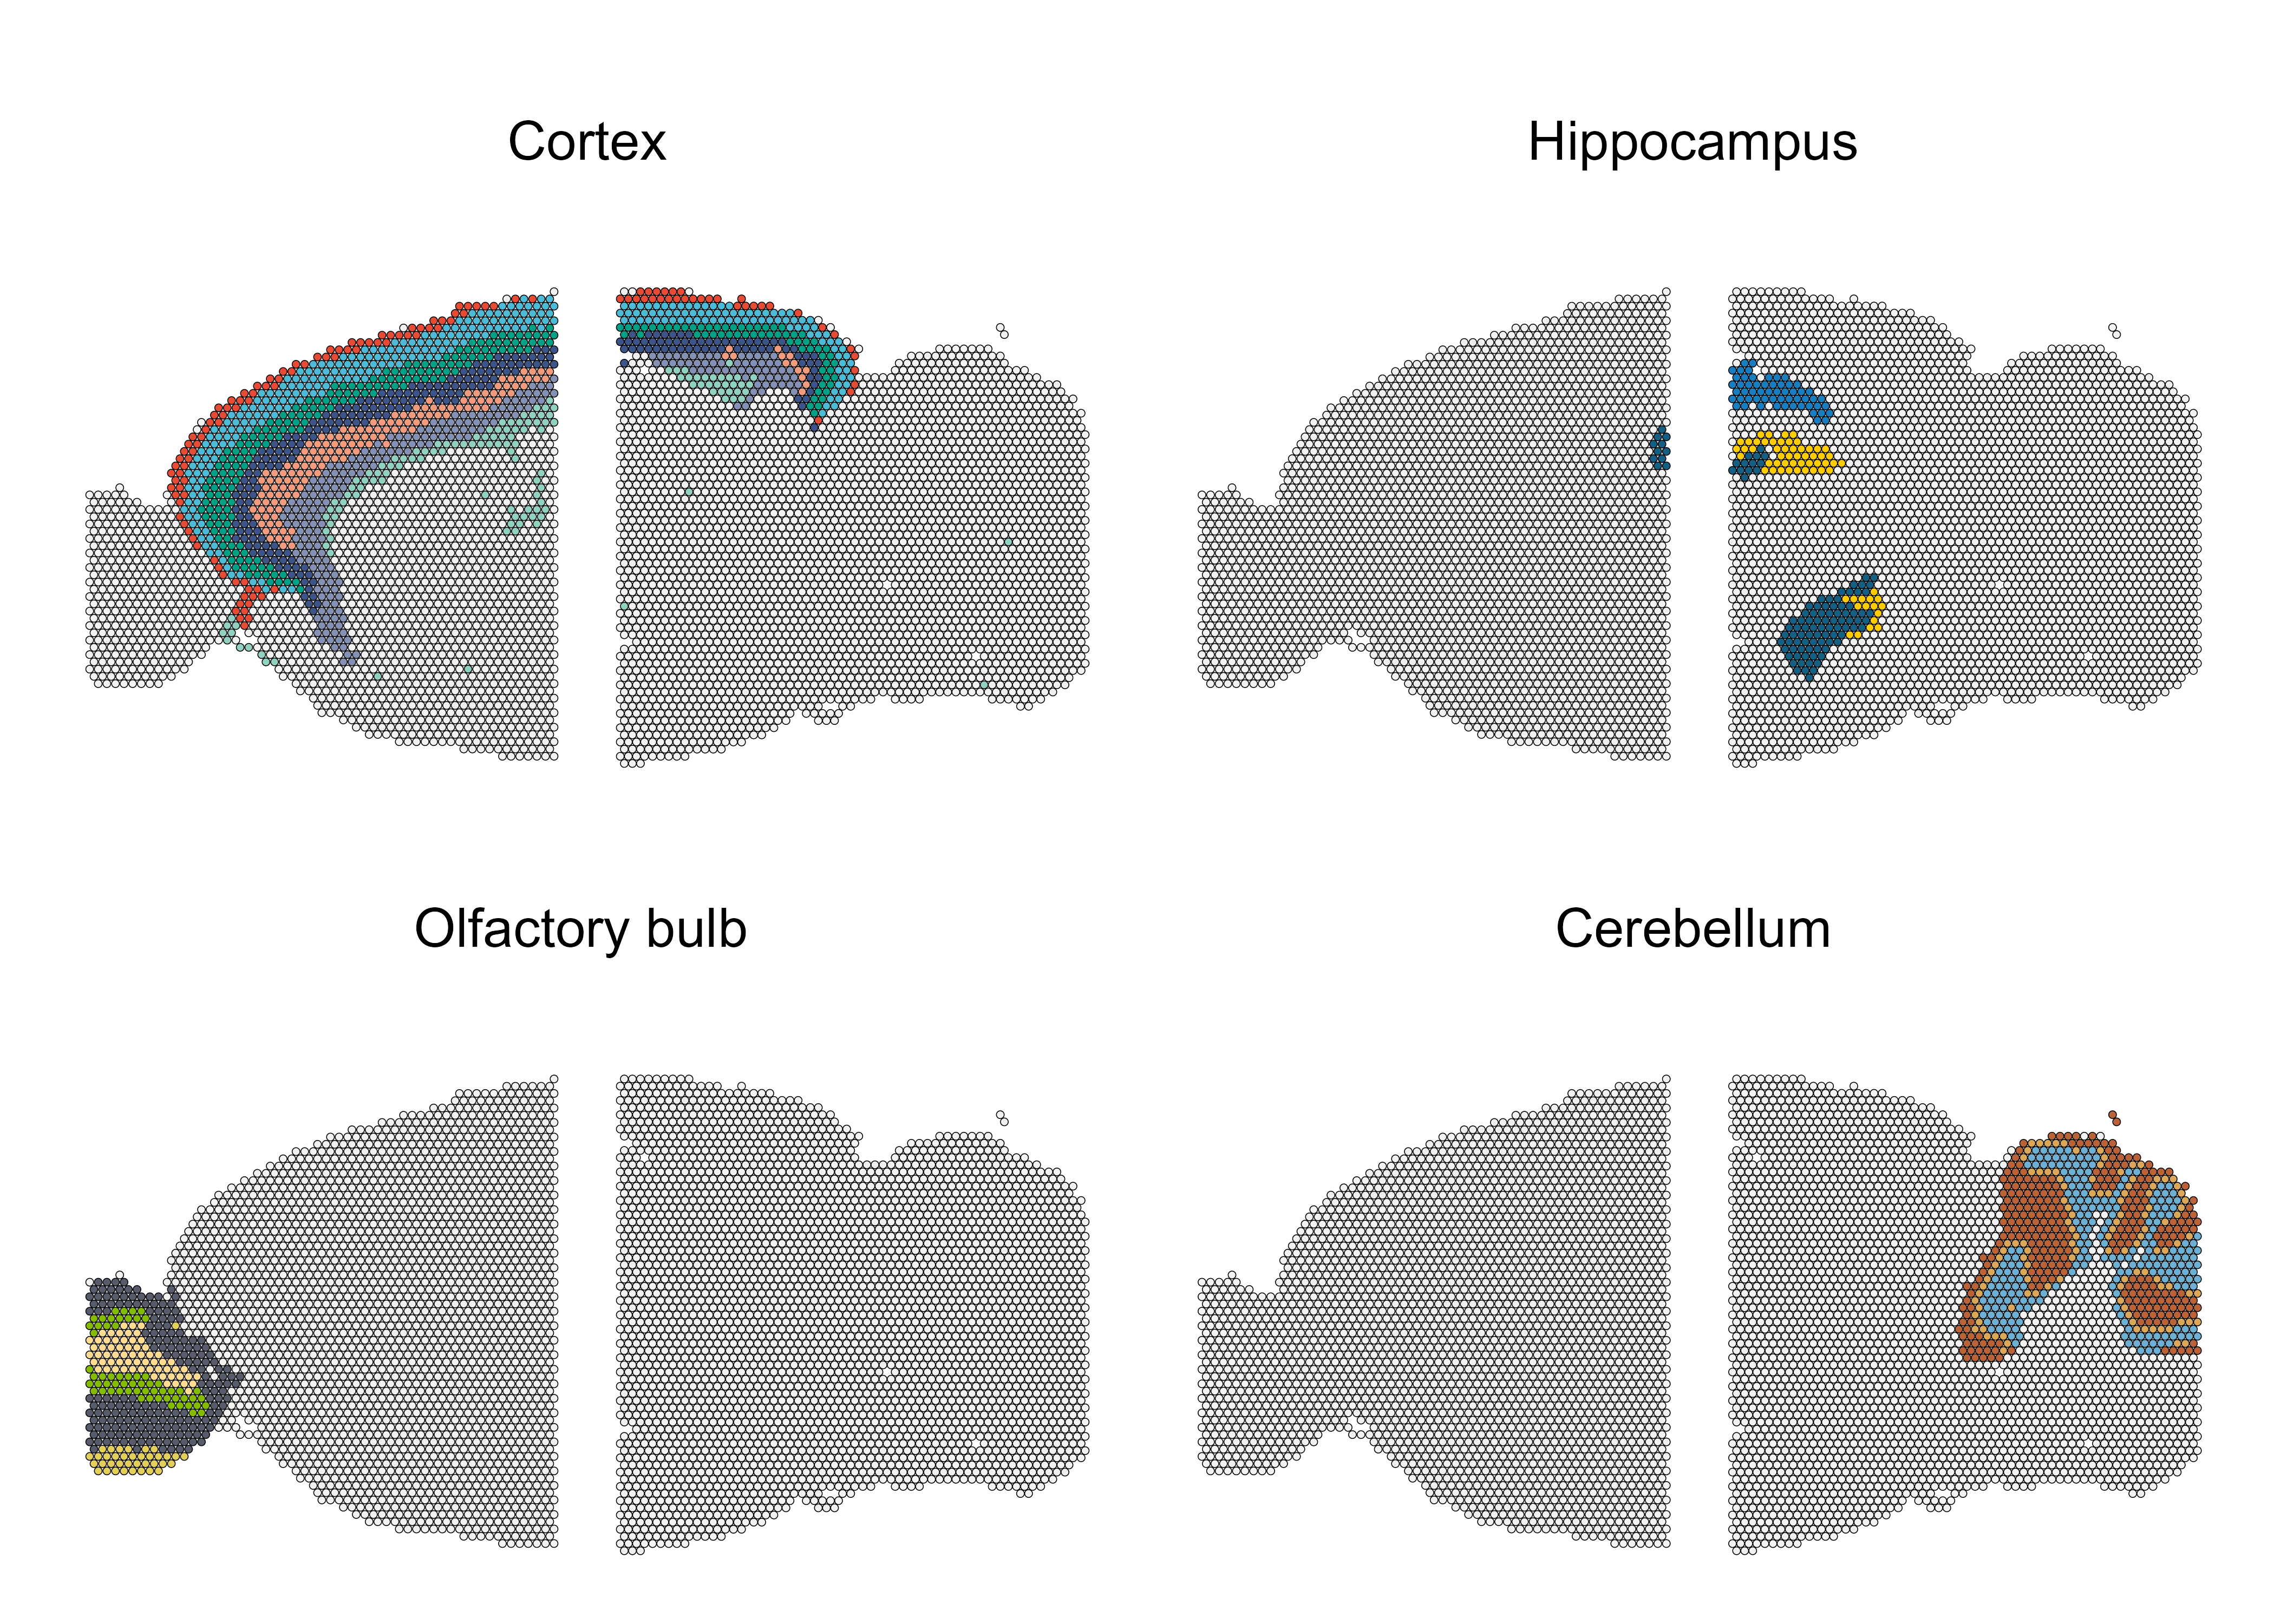
To view if STADIA could learn the particular tissues in mouse brain
well, we visualize the spots corresponding to the
Olfactory bylb, Cerebellum,
Cortex and Hippocampus tissue structures.
## choose domains
structure_domains <- list(c(8,9,7,3,20,13,12),
                          c(21,32,34),
                          c(11,14,22,24),
                          c(4,10,19))
## plot each tissue structure separately
plt <- structure_domains %>% lapply(function(inx) {
    col2use <- clusterCol
    col2use[-inx] <- "grey95"
    ((SpatialPlot(mbrain2[[1]], group.by = "stadia_annotation", image.alpha = 0, cols = col2use) + xlim(80,470)) |
            (SpatialPlot(mbrain2[[2]], group.by = "stadia_annotation", image.alpha = 0, cols = col2use)+ xlim(110, 525))) &
        theme(legend.position = "none", plot.margin = unit(c(0,0,0,0), "cm"))
})
## wrap plots
wrap_elements(grid::textGrob('Cortex')) + grid::textGrob('Hippocampus') + plt[[1]] + plt[[2]] +
    grid::textGrob('Olfactory bulb') + grid::textGrob('Cerebellum') + plt[[3]] + plt[[4]] +
    plot_layout(heights = c(1,3,1,3))